
Product Performance of furniture store through Evaluating sales volume and revenue
By Raymond Okolie-Alfre
Introduction
In the highly competitive furniture retail industry, understanding the performance of individual products is critical for maximizing profitability and ensuring customer satisfaction. This report focuses on analyzing product performance by evaluating sales volume and revenue, using a comprehensive transaction dataset from a furniture store.
The dataset provides detailed information on various transactions, including product types, colors, prices, and quantities sold. By analyzing these data points, we aim to identify the most and least popular products, understand trends in customer purchasing behavior, and assess the overall contribution of each product to the store’s revenue.
The analysis will cover key performance indicators such as total units sold, total revenue generated, and average revenue per transaction. Additionally, we will explore the impact of product characteristics, such as product color and price, on sales performance. By pinpointing top-performing products and those that may need strategic attention, this report will offer actionable insights to inform inventory management, marketing strategies, and product development.
This analysis is intended to provide the furniture store with valuable information that can be used to optimize operations, enhance customer satisfaction, and drive sustained growth in a competitive market.
Some assumptions
Here are three assumptions we can make from the furniture store transaction dataset:
1. Seasonal Variations in Sales: It can be assumed that certain products might experience seasonal variations in sales.
2. Customer Preference for Product Attributes: Another assumption is that customers may have preferences for specific product attributes
3. Repeat Customer Behavior: It can be assumed that a portion of the transactions in the dataset may come from repeat customers who have a preference for specific products or product categories.
Questions to Answer
Here are four key questions to answer as we analyze the furniture store transaction dataset, focusing on product performance through evaluating sales volume and revenue:
1. Which Products Generate the Highest and Lowest Revenue?
This question seeks to identify the top-performing products in terms of total revenue generated. Understanding which products contribute the most to the store’s overall revenue can inform decisions about inventory management and marketing strategies.
2. What is the Relationship Between Sales Volume and Revenue for Each Product?
This question aims to explore whether higher sales volumes directly correlate with higher revenue or if certain products generate significant revenue even with lower sales volumes. This can help identify high-value products that may require different pricing or promotional strategies.
3. How Do Product Attributes (e.g., Color, Price) Affect Sales Performance?
This question focuses on understanding how specific attributes, such as product color or price, influence sales volume and revenue. Insights from this analysis can guide product development and inventory decisions by highlighting customer preferences.
4. Are There Seasonal Trends in Product Sales Volume and Revenue?
This question examines whether certain products experience fluctuations in sales volume and revenue during specific times of the year. Identifying seasonal trends can help the store optimize stock levels and plan targeted promotions during peak periods
We shall be producing the report with the following deliverables:
1 A clear summary of the business task
2 A description of all data sources used
3 Documentation of any cleaning or manipulation of data
4 A summary of your analysis
5 Supporting visualizations and key findings
6 Your top high-level content recommendations based on your analysis
To answer the key questions, I will follow the steps of the data analysis process of ask, prepare, process, analyze, share, and act as a guide to answering this question.
1 Phase: Ask
#What is the problem you are trying to solve?
I am trying to analyze the Product Performance by Evaluating sales volume and revenue
#How can insights got drive business decisions?
Insights from analysis can drive business decisions by optimizing inventory management, ensuring that popular products are well-stocked while minimizing excess inventory of less popular items. They inform pricing strategies by revealing how different price points impact sales volume and revenue, enabling the business to set competitive and profitable prices. Targeted marketing campaigns can be developed based on customer preferences and seasonal trends, enhancing the effectiveness of promotions and advertisements. Additionally, these insights guide resource allocation, focusing efforts on high-performing products and customer segments to maximize returns and support business growth.
#identify the business task
The business task is to analyze the furniture store transaction dataset to evaluate product performance by examining sales volume and revenue. The goal is to identify which products are the most and least popular, understand the factors driving their performance, and provide actionable insights that can inform decisions on inventory management, pricing, and marketing strategies. This analysis will help the business optimize operations and improve profitability.
#Consider key stakeholders
1. The managing director
2. Operation Manager
3. The brand manager
4 Marketing analytics team
#The product: All the loan default
The furniture store transaction dataset contains detailed records of sales, including product types, colors, prices, and quantities purchased. This dataset serves as the basis for analyzing product performance, focusing on evaluating sales volume and revenue to inform business decisions.
2 Phase 2: Prepare
#Where is your data stored?
The dataset is saved in a CSV file, in an excel and The data is on a furniture store dataset in the Public Domain, The dataset made available through Mobius by Keggle
#How is the data organized? Is it in a long or wide format?
The data set contains a single CSV file organized in a long format.
#Are there issues with bias or credibility in this data? Does your data ROCCC?
Taking the data through the ROCCC,i can say that they are limitations and biases with the data as it only contains a file of about 28.48mb.
#ROCCC analysis
- Reliable — LOW — Not reliable as it only has a single file.
- Original — LOW — Third-party provider (Amazon Mechanical Turk)
- Comprehensive — MED — Parameters did not cover most parameters
- Current — LOW — Data is 5 years old and may not be relevant now
- Cited — LOW — Data collected from third party, hence unknown
The dataset is considered bad quality data in all as it does not meet the ROCCC requirement hence it is not recommended to produce business recommendations based on this data.
#How are you addressing licensing, privacy, security, and accessibility?
Since it is a public data, there is no issure with licensing, privacy, security, and accessibility of the dataset
#How did you verify the data’s integrity?
Due to the fact that the data is collected in a survey, we are cannot ascertain its integrity or accuracy.
#How does it help you answer your question?
The furniture store transaction dataset helps answer key questions by providing detailed information on sales volume, revenue, and product attributes such as type, color, and price. By analyzing these data points, we can identify the most and least popular products, understand customer preferences, and uncover trends that drive product performance. This analysis enables the business to make data-driven decisions on inventory, pricing, and marketing strategies..
#Are there any problems with the data?
This Data is not current as it was collected in 3022 and so the market trends must have change and market size either grows or reduces.
3 Phase3:Process
#We Process the data by cleaning and ensuring that it is correct, relevant, complete and free of error and outline.
1 Installing of packages
#install the needed package
install.packages(“tidyverse”)
install.packages(“lubridate”)
install.packages(“ggplot2”)
install.packages(“skimr”)
install.packages(“janitor”)
install.packages(“readr”)
install.packages(“plyr”)
install.packages(“dplyr”)
Load the needed Library
library(tidyverse)
## ── Attaching core tidyverse packages ──────────────────────── tidyverse 2.0.0 ──
## ✔ dplyr 1.1.4 ✔ readr 2.1.5
## ✔ forcats 1.0.0 ✔ stringr 1.5.1
## ✔ ggplot2 3.5.1 ✔ tibble 3.2.1
## ✔ lubridate 1.9.3 ✔ tidyr 1.3.1
## ✔ purrr 1.0.2
## ── Conflicts ────────────────────────────────────────── tidyverse_conflicts() ──
## ✖ dplyr::filter() masks stats::filter()
## ✖ dplyr::lag() masks stats::lag()
## ℹ Use the conflicted package (<http://conflicted.r-lib.org/>) to force all conflicts to become errors
library(ggplot2)
library(lubridate)
library(skimr)
library(janitor)
##
## Attaching package: ‘janitor’
##
## The following objects are masked from ‘package:stats’:
##
## chisq.test, fisher.test
library(readr)
library(plyr)
## ——————————————————————————
## You have loaded plyr after dplyr – this is likely to cause problems.
## If you need functions from both plyr and dplyr, please load plyr first, then dplyr:
## library(plyr); library(dplyr)
## ——————————————————————————
##
## Attaching package: ‘plyr’
##
## The following objects are masked from ‘package:dplyr’:
##
## arrange, count, desc, failwith, id, mutate, rename, summarise,
## summarize
##
## The following object is masked from ‘package:purrr’:
##
## compact
getwd()
## [1] “C:/Users/ME/Desktop/Factresort material/factreslrt 4 May/factresort for june/CVs and Cover Letter/BI Images”
##import/load dataset
library(readr)
Furniture_Store_Transaction_Table <- read_csv(“C:/Users/ME/Desktop/Factresort material/factreslrt 4 May/factresort for june/CVs and Cover Letter/New folder/Furniture-Store-Transaction-Table.csv”)
## Rows: 29 Columns: 10
## ── Column specification ────────────────────────────────────────────────────────
## Delimiter: “,”
## chr (6): date, product, product_code, product_color, product_price, revenue
## dbl (4): transaction_id, customer_id, purchase_size, purchase_price
##
## ℹ Use `spec()` to retrieve the full column specification for this data.
## ℹ Specify the column types or set `show_col_types = FALSE` to quiet this message.
##creating a dataframe for the dataset
Furniture_store1 <- data.frame(Furniture_Store_Transaction_Table)
#step2: WRANGLING OF DATA
Check column names each
## [1] “date” “transaction_id” “customer_id” “product”
## [5] “product_code” “product_color” “product_price” “purchase_size”
## [9] “purchase_price” “revenue”
#remove rows with NA
Furniture_store2 <- Furniture_store1 %>% drop_na()
##Changeing the date format
Furniture_store2$date <- as.Date(Furniture_store2$date, format=”%m/%d/%Y”)
##Add columns that list the date, month, day, and year of each ride
Furniture_store2$date <- as.Date(Furniture_store2$date)
Furniture_store2$month <- format(as.Date(Furniture_store2$date), “%m”)
Furniture_store2$day <- format(as.Date(Furniture_store2$date), “%d”)
Furniture_store2$year <- format(as.Date(Furniture_store2$date), “%Y”)
Furniture_store2$day_of_week <- format(as.Date(Furniture_store2$date), “%A”)
Convert numeric month to month name
Furniture_store2$month_name <- month(Furniture_store2$date, label = TRUE, abbr = FALSE)
Remove dollar signs and convert to numeric
Furniture_store3 <- Furniture_store2 %>%
mutate(product_price = as.numeric(gsub(“\\$”, “”, product_price)),
revenue = as.numeric(gsub(“\\$”, “”, revenue)))
## Warning in eval(cols[[col]], .data, parent.frame()): NAs introduced by coercion
## Warning in eval(cols[[col]], .data, parent.frame()): NAs introduced by coercion
Round up to the nearest whole number using the ceiling function
Furniture_store4 <- Furniture_store3 %>%
mutate(product_price = ceiling(product_price),
revenue = ceiling(revenue),
purchase_price = ceiling(purchase_price))
# Replace NA with 0
Furniture_store5 <- Furniture_store4 %>%
mutate(revenue = replace_na(revenue, 0),
product_price = replace_na(product_price, 0))
head(Furniture_store5, 5)
## date transaction_id customer_id product product_code product_color
## 1 2020-08-29 9900 1980 fan SKU83503 brass
## 2 2020-05-01 12315 2463 fan SKU83503 brass
## 3 2020-12-12 9890 1978 fan SKU83503 white
## 4 2020-02-16 46915 9383 fan SKU83503 black
## 5 2020-12-28 44700 8940 fan SKU83503 brass
## product_price purchase_size purchase_price revenue month day year day_of_week
## 1 14 2 28 28 08 29 2020 Saturday
## 2 14 2 28 28 05 01 2020 Friday
## 3 14 1 14 14 12 12 2020 Saturday
## 4 14 1 14 14 02 16 2020 Sunday
## 5 14 2 28 28 12 28 2020 Monday
## month_name
## 1 August
## 2 May
## 3 December
## 4 February
## 5 December
STEP 4: ANALYSIS
##Descriptive analysis of the cleaned furniture data # Summary statistics for the numeric columns
summary(Furniture_store5)
## date transaction_id customer_id product
## Min. :2020-01-23 Min. : 1675 Min. : 335 Length:27
## 1st Qu.:2020-04-28 1st Qu.:12438 1st Qu.:2488 Class :character
## Median :2020-07-22 Median :23435 Median :4687 Mode :character
## Mean :2020-07-17 Mean :27468 Mean :5494
## 3rd Qu.:2020-10-11 3rd Qu.:45050 3rd Qu.:9010
## Max. :2020-12-30 Max. :49430 Max. :9886
##
## product_code product_color product_price purchase_size
## Length:27 Length:27 Min. : 0.00 Min. :1.000
## Class :character Class :character 1st Qu.: 0.00 1st Qu.:1.000
## Mode :character Mode :character Median : 14.00 Median :1.000
## Mean : 84.81 Mean :1.481
## 3rd Qu.: 90.00 3rd Qu.:2.000
## Max. :800.00 Max. :5.000
##
## purchase_price revenue month day
## Min. : 14.0 Min. : 0.0 Length:27 Length:27
## 1st Qu.: 74.5 1st Qu.: 0.0 Class :character Class :character
## Median : 200.0 Median : 28.0 Mode :character Mode :character
## Mean : 441.0 Mean :110.2
## 3rd Qu.:1000.0 3rd Qu.:175.0
## Max. :1000.0 Max. :800.0
##
## year day_of_week month_name
## Length:27 Length:27 February:4
## Class :character Class :character July :4
## Mode :character Mode :character December:4
## October :3
## April :2
## June :2
## (Other) :8
#Analysis and implications of Summary Data:
The Analysis
#Transaction Trends
The dataset covers transactions from January 23, 2020, to December 30, 2020, with transaction IDs ranging from 1675 to 49430. This shows that the store had consistent transactions throughout the year, peaking in mid-2020 (July). The wide range in transaction and customer IDs suggests steady growth in sales.
#Product Pricing and Purchase Size:
The product prices vary significantly, with a median of $14 but a mean of $84.81, indicating that most items are low-priced, though some expensive items push up the average. Purchase sizes are small, with a median of 1 item per transaction and a maximum of 5 items, showing that customers typically buy individual products.
#Revenue Distribution:
The mean revenue is $110.2 per transaction, but the median is $28, reflecting that most sales generate low revenue, with occasional high-revenue transactions (up to $800) driving the average higher. This suggests that the store likely relies on a few high-ticket sales to maintain profitability.
#Seasonality and Sales Patterns:
Sales activity appears consistent across months, with notable peaks in February, July, and December. These could correspond to promotional events or holiday seasons, indicating opportunities for targeted marketing during these months.
The Implications
#Growth Opportunities:
The consistent range of transactions throughout the year implies potential for scaling through promotions and customer engagement strategies, particularly around high-sales months like July and December.
#Product and Price Strategy:
Given the wide variation in product prices, there may be an opportunity to diversify the product range to capture both budget-conscious consumers and high-end buyers, while focusing on upselling to increase the average purchase size.
#Revenue Optimization:
Since a large portion of sales generate lower revenues, strategies such as bundling, discounts on multiple items, or loyalty programs could be implemented to boost purchase sizes and average transaction values.
#Marketing and Seasonal Planning:
Sales spikes during certain months suggest that the store could leverage seasonal trends by running targeted promotions and marketing campaigns to further capitalize on holiday and event-driven shopping behaviors.
#To save the clean dataset in a csv file
write.csv(Furniture_store5, “furniture.csv”,row.names = FALSE)
write.csv(Furniture_store5, “furniture.csv”)
For further analysis, I then moved the cleaned dataset to Tableau so as to visualize more patterns and trends in order to have a detailed analysis and great insights
The Analysis: Here, I will be analyzing and explaining the visuals and of causing their implication

The bar chart above displays the revenue generated by different products, showing that the rug and bed are the top revenue-generating items with 810 and 800 units of revenue, respectively, while products like the couch generated no revenue and the vase generated only 20 units. This suggests that businesses should focus on promoting high-performing products like the rug and bed while addressing the poor performance of low-revenue products like the couch and vase to boost overall sales.
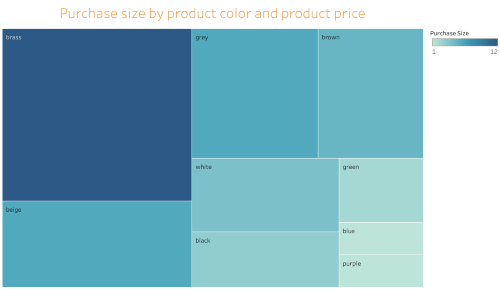
The treemap visualizes the purchase size distribution by product color and price, showing that brass and beige products have the largest purchase sizes, while colors like blue and purple have much smaller purchase sizes. This implies that products in brass and beige colors are more popular among customers, suggesting a focus on stocking and promoting these colors to meet the demand

The scatter plot above shows the relationship between purchase size and revenue, with each data point representing a different value pair. The bubble sizes indicate the relative quantity or importance of the data points, with larger bubbles suggesting greater significance. The chart indicates that higher purchase sizes do not necessarily correlate with proportionately higher revenues, suggesting variability in customer behavior and revenue outcomes

The bar chart displays the purchase size across different days of the week and months, with each color representing a different product. The chart reveals that purchase activity is highest on Mondays, particularly for products like the couch and desk, while activity varies for other products across the week and months. This implies that certain products have peak purchasing days, which could be useful for inventory planning and marketing efforts.
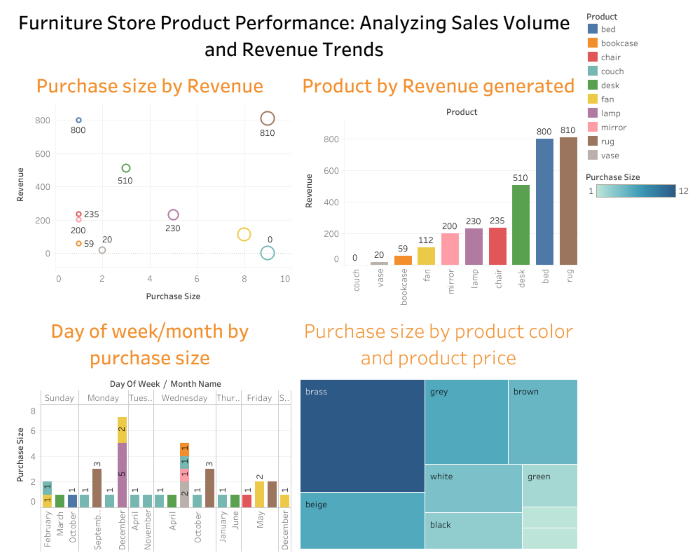
The dashboard

The dashboard analyzes sales volume and revenue trends for a furniture store. Here’s an interpretation of each section:
1. Purchase Size by Revenue (Top-Left Chart)
- Description: This bubble chart shows the relationship between purchase size (number of items sold) and revenue for each product type.
- Insights:
- The rug and bed are the top revenue-generating products, with revenues of 810 and 800 respectively, despite having smaller purchase sizes compared to some other products. This suggests high individual unit value.
- The desk also performs well, with a revenue of 510, though it has a lower purchase size than the rug and bed.
- Vases, couches, and bookcases have the lowest revenues and purchase sizes, indicating weak sales performance for these products.
2. Product by Revenue Generated (Top-Right Bar Chart)
- Description: This bar chart illustrates the revenue generated by each product.
- Insights:
- Rugs and beds are the highest revenue-generating products, followed by desks.
- Chair, lamps, mirrors, and fans generate moderate revenue.
- Couch, vases, and bookcases generate negligible or no revenue, indicating the need to reconsider these products.
3. Day of Week/Month by Purchase Size (Bottom-Left Bar Chart)
- Description: This chart shows the purchase size based on different months and days of the week.
- Insights:
- The highest purchase activity is seen in September and April, with Mondays showing significant purchase sizes.
- December and October also have notable purchase activity.
- Sundays and some mid-week days have relatively low purchase activity, suggesting customers may prefer shopping at the beginning of the week or during specific times of the year.
4. Purchase Size by Product Color and Price (Bottom-Right TreeMap)
- Description: This treemap shows the purchase size by product color.
- Insights:
- Brass and beige are the most popular colors, with larger purchase sizes compared to other colors.
- Grey, brown, white, and green also have reasonable purchase sizes, whereas black has lower purchase activity.
- This indicates a preference for neutral and warm colors, suggesting that increasing stock of items in these colors might boost sales.
Summary
- Best-Selling Products: Focus on promoting and stocking rugs, beds, and desks as they are the highest revenue generators.
- Underperforming Products: Consider revising strategies for vases, couches, and bookcases, such as offering discounts or even discontinuing these items.
- Seasonal and Weekly Trends: Focus marketing efforts on September, April, and December, and boost promotions on Mondays when sales are higher.
- Color Preferences: Increase inventory of brass and beige-colored products, and consider expanding offerings in these colors to drive higher sales.
Based on the comprehensive analysis of the furniture store’s product performance, here are the top five detailed recommendations:
1. Focus on High-Performing Products (Rug and Bed)
- Observation: The rug and bed generate the highest revenue, with 810 and 800 units respectively, indicating strong customer demand for these items.
- Recommendation:
- Allocate more inventory space and promotional efforts to these products to maximize their potential.
- Consider offering variations in style, size, and price to cater to different customer segments and further boost sales.
- Run targeted marketing campaigns featuring these products during peak sales periods, such as holidays or promotional events, to capitalize on existing demand.
2. Revitalize Poor-Performing Products (Couch and Vase)
- Observation: The couch and vase have generated little to no revenue, indicating they are underperforming in comparison to other items.
- Recommendation:
- Re-evaluate the current pricing and positioning of these products to make them more appealing to customers. Consider offering discounts, bundles, or promotions to clear excess inventory.
- Analyze customer feedback or conduct focus groups to understand why these products are not resonating and make necessary adjustments, such as redesign or repositioning them within the store.
- If necessary, discontinue these products and replace them with more promising items to optimize the inventory.
3. Capitalize on Popular Colors (Brass and Beige)
- Observation: Products in brass and beige colors have significantly larger purchase sizes, suggesting that customers have a strong preference for these colors.
- Recommendation:
- Increase stock levels for brass and beige products, particularly for popular items such as rugs and beds, to ensure availability and avoid missed sales opportunities.
- Highlight brass and beige color options in marketing materials, both in-store and online, to attract more customers.
- Consider introducing new products in these colors to meet customer demand and expand the product range.
4. Leverage Seasonal Trends and Peak Purchase Days
- Observation: Sales data shows significant peaks during certain months (February, July, and December) and specific days of the week (e.g., Mondays).
- Recommendation:
- Develop targeted promotional campaigns during high-sales months, particularly for best-selling items like rugs and beds, to maximize revenue during peak demand periods.
- Adjust staffing levels and inventory planning to accommodate increased demand during these peak months and days.
- Consider offering time-limited promotions on popular days of the week to drive traffic to the store.
5. Increase Average Transaction Size through Bundling and Upselling
- Observation: The data shows that most transactions involve the purchase of a single item, and a large portion of sales generate lower revenues.
- Recommendation:
- Implement bundling strategies to increase the average transaction value. For example, offer discounts when customers purchase related items together, such as a bed and a matching rug.
- Train sales staff to upsell and cross-sell complementary products, particularly during peak times when customers are already more inclined to make a purchase.
- Introduce a loyalty program to encourage repeat customers to purchase additional items, providing incentives for larger purchase sizes over time.
These recommendations aim to help the furniture store optimize product offerings, inventory, and marketing strategies to maximize revenue and improve overall performance in a competitive market.