
What are The Impact of Credit Scores on Loan Approval and Default Rates Across Different Regions
Raymond Okolie-Alfred
-
Introduction
The Impact of Credit Score on Loan Approval and Default Rates Across Different Regions” offers a comprehensive analysis of how credit scores influence lending decisions and the likelihood of loan defaults, with a focus on regional variations.
Credit scores serve as a crucial metric for lenders to assess the creditworthiness of applicants, with higher scores generally indicating lower risk.
In this analysis, we examine how credit scores affect loan approval rates, exploring whether applicants with similar scores receive different outcomes depending on the region they are in.
Additionally, we investigate the correlation between credit scores and default rates, identifying patterns that may suggest regional differences in economic conditions, borrower behavior, or lending practices.
For instance, we consider whether regions with stricter lending criteria have lower default rates or if regions with more lenient approval processes experience higher default rates.
This analysis not only sheds light on the role of credit scores in the lending process but also provides insights into regional economic disparities and the effectiveness of credit scoring as a predictive tool for loan performance.
Understanding these dynamics can help policymakers, financial institutions, and consumers navigate the complexities of credit markets and make informed decisions
2 Some assumptions
Here are four possible assumptions we can make from the loan default dataset:
2.1. Credit Scores are Consistent Predictors of Loan Default Risk: It is assumed that higher credit scores correlate with lower default rates, as they reflect a borrower’s history of responsible financial behavior.
2.2. Regional Economic Conditions Influence Loan Outcomes: The dataset may reflect that loan approval and default rates vary by region due to differences in economic stability, job market conditions, and regional lending practices.
2.3. Loan Terms and Conditions Affect Default Rates: It is assumed that factors such as loan amount, interest rates, loan-to-value (LTV) ratio, and upfront charges impact the likelihood of a borrower defaulting on a loan.
2.4. Demographic Factors Influence Loan Approval: The dataset may suggest that demographic variables, such as age, gender, and income level, play a role in the likelihood of loan approval, potentially due to varying risk assessments by lenders
-
Questions to Answer
Based on the dataset’s structure and contents, here are four potential analytics questions:
3.1. What are the key factors influencing loan default rates? This question aims to identify which variables (e.g., credit score, loan type, region) are most strongly associated with the likelihood of a loan default.
3.2. How does the loan approval status vary across different demographics and loan characteristics? This explores the approval rates based on variables such as gender, loan purpose, creditworthiness, and income.
3.3. What is the relationship between the loan-to-value (LTV) ratio and the probability of default? This investigates whether there is a correlation between the LTV ratio and the likelihood of defaulting on a loan.
3.4. How do interest rates and upfront charges affect the loan status (default or non-default)? This analyzes how variations in the rate of interest and upfront charges influence whether a loan is likely to default
4 We shall be producing the report with the following deliverables:
4.1 A clear summary of the business task
4.2 A description of all data sources used
4.3 Documentation of any cleaning or manipulation of data
4.4 A summary of your analysis
4.5 Supporting visualizations and key findings
4.6 Your top high-level content recommendations based on your analysis
5. To answer the key questions, I will follow the steps of the data analysis process of ask, prepare, process, analyze, share, and act as a guide to answering this question.
5.1 Phase: Ask
#what is the problem you are trying to solve?
We are trying to find trends and patterns in the Impact of credit scores on Loan approval and default rates across different regions
#how can insights drive business decisions?
Insights derived from data analysis can business decisions by identifying key factors influencing business outcomes, enabling targeted strategies to improve performance and mitigate risks.
They help businesses understand customer behavior, optimize resource allocation, and tailor products or services to meet market demand.
By providing actionable information, these insights support informed decision-making, enhancing operational efficiency and competitive advantage.
#identify the business task
The business task is to analyze The Impact of credit scores on loan approval and default rates across different regions, that is, to analyze the relationship between credit scores, loan approval rates, and default rates across different regions.
This involves identifying key factors that influence these outcomes and understanding how regional variations impact lending decisions and borrower behavior.
The goal is to use these insights to optimize lending strategies, manage or minimize risk, and improve financial performance.
#Consider key stakeholders
1. The managing director
2. Board of directors
3. The brand manager
4 Marketing analytics team
#The product: All the loan default
The loan default dataset encompasses roles that involve the collection, analysis, interpretation, and presentation of data to help organizations make informed decisions.
Experts in this field use statistical techniques, programming skills, and domain knowledge to extract meaningful insights from large and complex datasets.
Here are some common credit scores on loan approval and default rates. These different credit scores: Such as loan amount, rate of interest etc.
The credit score is designed to offer organization, using data to make insightful decisions that will lead to growth in business
5.2 Phase 2: Prepare
#where is your data stored?
The dataset is saved in a CSV file, in an excel and The data is on loan default dataset in the Public Domain, The dataset made available through Mobius by Keggle
#How is the data organized? Is it in a long or wide format?
The data set contains a single CSV file organized in a long format.
#Are there issues with bias or credibility in this data? Does your data ROCCC?
Taking the data through the ROCCC,i can say that they are limitations and biases with the data as it only contains a file of about 28.48mb.
#ROCCC analysis
- Reliable — LOW — Not reliable as it only has a single file.
- Original — LOW — Third party provider (Amazon Mechanical Turk)
- Comprehensive — MED — Parameters did not cover most parameters
- Current — LOW — Data is 5 years old and may not be relevant now
- Cited — LOW — Data collected from third party, hence unknown
The dataset is considered bad quality data in all as it does not meet the ROCCC requirement hence it is not recommended to produce business recommendations based on this data.
#How are you addressing licensing, privacy, security, and accessibility?
Since it is a public data, there is no issue with licensing, privacy, security, and accessibility of the dataset
#How did you verify the data’s integrity?
Due to the fact that the data is collected in a survey, we are cannot ascertain its integrity or accuracy.
#How does it help you answer your question?
It can help to answer the question because the data explore loan default within a certain region and it covers:ID,year, loan limit, loan amount, rate of interest, interest rate, property value etc.
#Are there any problems with the data?
This Data is not current as it was collected in 2013 and so the market trends must have change and market size either grows or reduces.
5.3 Phase3: Process
#We Process the data by cleaning and ensuring that it is correct, relevant, complete and free of error and outline.
5.3.1 Installing of packages
#install the needed package
install.packages(“tidyverse”)
install.packages(“lubridate”)
install.packages(“ggplot2”)
install.packages(“skimr”)
install.packages(“janitor”)
install.packages(“readr”)
install.packages(“plyr”)
install.packages(“dplyr”)
##5.3.2 Load the needed Library
library(tidyverse)
## Warning: package ‘tidyverse’ was built under R version 4.3.3
## Warning: package ‘ggplot2’ was built under R version 4.3.3
## Warning: package ‘tidyr’ was built under R version 4.3.3
## Warning: package ‘readr’ was built under R version 4.3.3
## Warning: package ‘purrr’ was built under R version 4.3.3
## Warning: package ‘dplyr’ was built under R version 4.3.3
## Warning: package ‘stringr’ was built under R version 4.3.3
## Warning: package ‘lubridate’ was built under R version 4.3.3
## ── Attaching core tidyverse packages ──────────────────────── tidyverse 2.0.0 ──
## ✔ dplyr 1.1.4 ✔ readr 2.1.5
## ✔ forcats 1.0.0 ✔ stringr 1.5.1
## ✔ ggplot2 3.5.1 ✔ tibble 3.2.1
## ✔ lubridate 1.9.3 ✔ tidyr 1.3.1
## ✔ purrr 1.0.2
## ── Conflicts ────────────────────────────────────────── tidyverse_conflicts() ──
## ✖ dplyr::filter() masks stats::filter()
## ✖ dplyr::lag() masks stats::lag()
## ℹ Use the conflicted package (<http://conflicted.r-lib.org/>) to force all conflicts to become errors
library(ggplot2)
library(lubridate)
library(skimr)
## Warning: package ‘skimr’ was built under R version 4.3.3
library(janitor)
## Warning: package ‘janitor’ was built under R version 4.3.3
##
## Attaching package: ‘janitor’
##
## The following objects are masked from ‘package:stats’:
##
## chisq.test, fisher.test
library(readr)
library(plyr)
## Warning: package ‘plyr’ was built under R version 4.3.3
## ——————————————————————————
## You have loaded plyr after dplyr – this is likely to cause problems.
## If you need functions from both plyr and dplyr, please load plyr first, then dplyr:
## library(plyr); library(dplyr)
## ——————————————————————————
##
## Attaching package: ‘plyr’
##
## The following objects are masked from ‘package:dplyr’:
##
## arrange, count, desc, failwith, id, mutate, rename, summarise,
## summarize
##
## The following object is masked from ‘package:purrr’:
##
## compact
getwd()
## [1] “C:/Users/ME/Desktop/Factresort material/factreslrt 4 May/factresort for june/CVs and Cover Letter/New folder”
#5.3.3import/load dataset
library(readr)
Loan_Default_Dataset <- read_csv(“C:/Users/ME/Desktop/Factresort material/factreslrt 4 May/factresort for june/CVs and Cover Letter/Loan Default Dataset.csv”)
## Rows: 148670 Columns: 34
## ── Column specification ────────────────────────────────────────────────────────
## Delimiter: “,”
## chr (21): loan_limit, Gender, approv_in_adv, loan_type, loan_purpose, Credit…
## dbl (13): ID, year, loan_amount, rate_of_interest, Interest_rate_spread, Upf…
##
## ℹ Use `spec()` to retrieve the full column specification for this data.
## ℹ Specify the column types or set `show_col_types = FALSE` to quiet this message.
#5.3.4 creating a dataframe for the dataset
Loan_Default1 <- data.frame(Loan_Default_Dataset)
#step2: WRANGLING OF DATA
##5.3.5 Check column names each
## [1] “ID” “year”
## [3] “loan_limit” “Gender”
## [5] “approv_in_adv” “loan_type”
## [7] “loan_purpose” “Credit_Worthiness”
## [9] “open_credit” “business_or_commercial”
## [11] “loan_amount” “rate_of_interest”
## [13] “Interest_rate_spread” “Upfront_charges”
## [15] “term” “Neg_ammortization”
## [17] “interest_only” “lump_sum_payment”
## [19] “property_value” “construction_type”
## [21] “occupancy_type” “Secured_by”
## [23] “total_units” “income”
## [25] “credit_type” “Credit_Score”
## [27] “co.applicant_credit_type” “age”
## [29] “submission_of_application” “LTV”
## [31] “Region” “Security_Type”
## [33] “Status” “dtir1”
#Clean dataset
tibble::as_tibble(Loan_Default1)
## # A tibble: 148,670 × 34
## ID year loan_limit Gender approv_in_adv loan_type loan_purpose
## <dbl> <dbl> <chr> <chr> <chr> <chr> <chr>
## 1 24890 2019 cf Sex Not Available nopre type1 p1
## 2 24891 2019 cf Male nopre type2 p1
## 3 24892 2019 cf Male pre type1 p1
## 4 24893 2019 cf Male nopre type1 p4
## 5 24894 2019 cf Joint pre type1 p1
## 6 24895 2019 cf Joint pre type1 p1
## 7 24896 2019 cf Joint pre type1 p3
## 8 24897 2019 <NA> Female nopre type1 p4
## 9 24898 2019 cf Joint nopre type1 p3
## 10 24899 2019 cf Sex Not Available nopre type3 p3
## # ℹ 148,660 more rows
## # ℹ 27 more variables: Credit_Worthiness <chr>, open_credit <chr>,
## # business_or_commercial <chr>, loan_amount <dbl>, rate_of_interest <dbl>,
## # Interest_rate_spread <dbl>, Upfront_charges <dbl>, term <dbl>,
## # Neg_ammortization <chr>, interest_only <chr>, lump_sum_payment <chr>,
## # property_value <dbl>, construction_type <chr>, occupancy_type <chr>,
## # Secured_by <chr>, total_units <chr>, income <dbl>, credit_type <chr>, …
# Print the top 10 rows of the dataset
head(Loan_Default1, 4)
## ID year loan_limit Gender approv_in_adv loan_type loan_purpose
## 1 24890 2019 cf Sex Not Available nopre type1 p1
## 2 24891 2019 cf Male nopre type2 p1
## 3 24892 2019 cf Male pre type1 p1
## 4 24893 2019 cf Male nopre type1 p4
## Credit_Worthiness open_credit business_or_commercial loan_amount
## 1 l1 nopc nob/c 116500
## 2 l1 nopc b/c 206500
## 3 l1 nopc nob/c 406500
## 4 l1 nopc nob/c 456500
## rate_of_interest Interest_rate_spread Upfront_charges term Neg_ammortization
## 1 NA NA NA 360 not_neg
## 2 NA NA NA 360 not_neg
## 3 4.56 0.200 595 360 neg_amm
## 4 4.25 0.681 NA 360 not_neg
## interest_only lump_sum_payment property_value construction_type
## 1 not_int not_lpsm 118000 sb
## 2 not_int lpsm NA sb
## 3 not_int not_lpsm 508000 sb
## 4 not_int not_lpsm 658000 sb
## occupancy_type Secured_by total_units income credit_type Credit_Score
## 1 pr home 1U 1740 EXP 758
## 2 pr home 1U 4980 EQUI 552
## 3 pr home 1U 9480 EXP 834
## 4 pr home 1U 11880 EXP 587
## co.applicant_credit_type age submission_of_application LTV Region
## 1 CIB 25-34 to_inst 98.72881 south
## 2 EXP 55-64 to_inst NA North
## 3 CIB 35-44 to_inst 80.01969 south
## 4 CIB 45-54 not_inst 69.37690 North
## Security_Type Status dtir1
## 1 direct 1 45
## 2 direct 1 NA
## 3 direct 0 46
## 4 direct 0 42
#Remove rows with NA
Loan_Default2 <-Loan_Default1 %>%
filter(complete.cases(.))
Check the structure of the dataset to confirm the column name
str(Loan_Default2)## ‘data.frame’: 98187 obs. of 34 variables:## $ ID : num 24892 24894 24895 24896 24898 …## $ year : num 2019 2019 2019 2019 2019 …## $ loan_limit : chr “cf” “cf” “cf” “cf” …## $ Gender : chr “Male” “Joint” “Joint” “Joint” …## $ approv_in_adv : chr “pre” “pre” “pre” “pre” …## $ loan_type : chr “type1” “type1” “type1” “type1” …## $ loan_purpose : chr “p1” “p1” “p1” “p3” …## $ Credit_Worthiness : chr “l1” “l1” “l1” “l1” …## $ open_credit : chr “nopc” “nopc” “nopc” “nopc” …## $ business_or_commercial : chr “nob/c” “nob/c” “nob/c” “nob/c” …## $ loan_amount : num 406500 696500 706500 346500 376500 …## $ rate_of_interest : num 4.56 4 3.99 4.5 4.88 …## $ Interest_rate_spread : num 0.2 0.304 0.152 1 0.74 …## $ Upfront_charges : num 595 0 370 5120 1150 …## $ term : num 360 360 360 360 360 360 360 360 360 360 …## $ Neg_ammortization : chr “neg_amm” “not_neg” “not_neg” “not_neg” …## $ interest_only : chr “not_int” “not_int” “not_int” “not_int” …## $ lump_sum_payment : chr “not_lpsm” “not_lpsm” “not_lpsm” “not_lpsm” …## $ property_value : num 508000 758000 1008000 438000 478000 …## $ construction_type : chr “sb” “sb” “sb” “sb” …## $ occupancy_type : chr “pr” “pr” “pr” “pr” …## $ Secured_by : chr “home” “home” “home” “home” …## $ total_units : chr “1U” “1U” “1U” “1U” …## $ income : num 9480 10440 10080 5040 5580 …## $ credit_type : chr “EXP” “CRIF” “EXP” “EXP” …## $ Credit_Score : num 834 602 864 860 580 788 501 773 629 688 …## $ co.applicant_credit_type : chr “CIB” “EXP” “EXP” “EXP” …## $ age : chr “35-44” “25-34” “35-44” “55-64” …## $ submission_of_application: chr “to_inst” “not_inst” “not_inst” “to_inst” …## $ LTV : num 80 91.9 70.1 79.1 78.8 …## $ Region : chr “south” “North” “North” “North” …## $ Security_Type : chr “direct” “direct” “direct” “direct” …## $ Status : num 0 0 0 0 0 0 0 0 0 0 …## $ dtir1 : num 46 39 40 44 44 30 36 39 44 31 …Loan_Default3 <- Loan_Default2 %>% mutate(age_midpoint = suppressWarnings(sapply(strsplit(as.character(age), “-“), function(x) { # Convert the split elements to numeric values numeric_values <- as.numeric(x) if (all(!is.na(numeric_values))) { # If all values are valid numbers, calculate the mean return(mean(numeric_values)) } else { # If any value is NA (i.e., invalid number), return NA return(NA) } })))
#Remove the NA
Loan_Default4 <-Loan_Default3 %>% filter(complete.cases(.))
Arrange the dataset in descending order by ‘loan_amount’
Loan_Default5 <- Loan_Default4 %>% arrange(desc(loan_amount)) # Print the top 10 rows of the datasethead(Loan_Default5, 4)## ID year loan_limit Gender approv_in_adv loan_type loan_purpose## 1 28652 2019 ncf Male nopre type1 p1## 2 79409 2019 ncf Sex Not Available nopre type1 p4## 3 139223 2019 ncf Sex Not Available nopre type1 p4## 4 58172 2019 ncf Joint nopre type1 p1## Credit_Worthiness open_credit business_or_commercial loan_amount## 1 l1 nopc nob/c 3006500## 2 l1 nopc nob/c 3006500## 3 l1 nopc nob/c 2986500## 4 l1 nopc nob/c 2506500## rate_of_interest Interest_rate_spread Upfront_charges term Neg_ammortization## 1 3.990 0.5414 60000.00 360 not_neg## 2 3.125 -0.3637 0.00 360 not_neg## 3 3.990 -0.2733 12328.84 360 not_neg## 4 3.500 -0.2034 21524.00 360 not_neg## interest_only lump_sum_payment property_value construction_type## 1 not_int not_lpsm 5258000 sb## 2 not_int not_lpsm 5758000 sb## 3 not_int not_lpsm 5508000 sb## 4 not_int not_lpsm 3858000 sb## occupancy_type Secured_by total_units income credit_type Credit_Score## 1 pr home 1U 50580 CRIF 620## 2 pr home 1U 66000 CRIF 798## 3 pr home 1U 61500 CIB 791## 4 pr home 1U 88440 CIB 713## co.applicant_credit_type age submission_of_application LTV Region## 1 CIB 45-54 not_inst 57.17954 North## 2 EXP 45-54 to_inst 52.21431 south## 3 CIB 45-54 to_inst 54.22113 south## 4 EXP 25-34 not_inst 64.96890 North## Security_Type Status dtir1 age_midpoint## 1 direct 0 42 49.5## 2 direct 0 22 49.5## 3 direct 0 21 49.5## 4 direct 0 8 29.5
Round up the ‘rate_of_interst’ column to the nearest whole number
Loan_Default6 <- Loan_Default5 %>% mutate(rate_of_interest = ceiling(rate_of_interest)) # View the first few rows to confirm the new columnhead(Loan_Default6)## ID year loan_limit Gender approv_in_adv loan_type loan_purpose## 1 28652 2019 ncf Male nopre type1 p1## 2 79409 2019 ncf Sex Not Available nopre type1 p4## 3 139223 2019 ncf Sex Not Available nopre type1 p4## 4 58172 2019 ncf Joint nopre type1 p1## 5 100082 2019 ncf Joint nopre type1 p1## 6 97097 2019 ncf Male nopre type1 p1## Credit_Worthiness open_credit business_or_commercial loan_amount## 1 l1 nopc nob/c 3006500## 2 l1 nopc nob/c 3006500## 3 l1 nopc nob/c 2986500## 4 l1 nopc nob/c 2506500## 5 l1 nopc nob/c 2506500## 6 l2 nopc nob/c 2086500## rate_of_interest Interest_rate_spread Upfront_charges term Neg_ammortization## 1 4 0.5414 60000.00 360 not_neg## 2 4 -0.3637 0.00 360 not_neg## 3 4 -0.2733 12328.84 360 not_neg## 4 4 -0.2034 21524.00 360 not_neg## 5 4 -0.3969 5185.00 360 not_neg## 6 3 -0.3111 9050.00 360 not_neg## interest_only lump_sum_payment property_value construction_type## 1 not_int not_lpsm 5258000 sb## 2 not_int not_lpsm 5758000 sb## 3 not_int not_lpsm 5508000 sb## 4 not_int not_lpsm 3858000 sb## 5 not_int not_lpsm 4218000 sb## 6 not_int not_lpsm 3208000 sb## occupancy_type Secured_by total_units income credit_type Credit_Score## 1 pr home 1U 50580 CRIF 620## 2 pr home 1U 66000 CRIF 798## 3 pr home 1U 61500 CIB 791## 4 pr home 1U 88440 CIB 713## 5 pr home 1U 34800 EXP 680## 6 pr home 1U 61980 EXP 811## co.applicant_credit_type age submission_of_application LTV Region## 1 CIB 45-54 not_inst 57.17954 North## 2 EXP 45-54 to_inst 52.21431 south## 3 CIB 45-54 to_inst 54.22113 south## 4 EXP 25-34 not_inst 64.96890 North## 5 EXP 45-54 not_inst 59.42390 south## 6 CIB 45-54 to_inst 65.04052 North## Security_Type Status dtir1 age_midpoint## 1 direct 0 42 49.5## 2 direct 0 22 49.5## 3 direct 0 21 49.5## 4 direct 0 8 29.5## 5 direct 0 40 49.5## 6 direct 0 35 49.5
#Round up the ‘upfront_charges’ column to the nearest whole number
Loan_Default7 <- Loan_Default6 %>% mutate(Upfront_charges = ceiling(Upfront_charges))
#summarize dataset
summary(Loan_Default7)## ID year loan_limit Gender ## Min. : 24892 Min. :2019 Length:93051 Length:93051 ## 1st Qu.: 61785 1st Qu.:2019 Class :character Class :character ## Median : 99170 Median :2019 Mode :character Mode :character ## Mean : 99113 Mean :2019 ## 3rd Qu.:136216 3rd Qu.:2019 ## Max. :173559 Max. :2019 ## approv_in_adv loan_type loan_purpose Credit_Worthiness ## Length:93051 Length:93051 Length:93051 Length:93051 ## Class :character Class :character Class :character Class :character ## Mode :character Mode :character Mode :character Mode :character ## ## ## ## open_credit business_or_commercial loan_amount rate_of_interest## Length:93051 Length:93051 Min. : 26500 Min. :3.000 ## Class :character Class :character 1st Qu.: 206500 1st Qu.:4.000 ## Mode :character Mode :character Median : 306500 Median :4.000 ## Mean : 337970 Mean :4.448 ## 3rd Qu.: 446500 3rd Qu.:5.000 ## Max. :3006500 Max. :8.000 ## Interest_rate_spread Upfront_charges term Neg_ammortization ## Min. :-1.0390 Min. : 0 Min. : 96.0 Length:93051 ## 1st Qu.: 0.1009 1st Qu.: 795 1st Qu.:360.0 Class :character ## Median : 0.3958 Median : 2780 Median :360.0 Mode :character ## Mean : 0.4639 Mean : 3379 Mean :333.2 ## 3rd Qu.: 0.7722 3rd Qu.: 4983 3rd Qu.:360.0 ## Max. : 3.3570 Max. :60000 Max. :360.0 ## interest_only lump_sum_payment property_value construction_type ## Length:93051 Length:93051 Min. : 28000 Length:93051 ## Class :character Class :character 1st Qu.: 288000 Class :character ## Mode :character Mode :character Median : 438000 Mode :character ## Mean : 510881 ## 3rd Qu.: 648000 ## Max. :6908000 ## occupancy_type Secured_by total_units income ## Length:93051 Length:93051 Length:93051 Min. : 120 ## Class :character Class :character Class :character 1st Qu.: 4140 ## Mode :character Mode :character Mode :character Median : 6120 ## Mean : 7328 ## 3rd Qu.: 8880 ## Max. :377220 ## credit_type Credit_Score co.applicant_credit_type age ## Length:93051 Min. :500.0 Length:93051 Length:93051 ## Class :character 1st Qu.:600.0 Class :character Class :character ## Mode :character Median :699.0 Mode :character Mode :character ## Mean :699.6 ## 3rd Qu.:800.0 ## Max. :900.0 ## submission_of_application LTV Region ## Length:93051 Min. : 3.084 Length:93051 ## Class :character 1st Qu.: 59.930 Class :character ## Mode :character Median : 73.990 Mode :character ## Mean : 71.346 ## 3rd Qu.: 83.915 ## Max. :136.538 ## Security_Type Status dtir1 age_midpoint ## Length:93051 Min. :0 Min. : 5.00 Min. :29.50 ## Class :character 1st Qu.:0 1st Qu.:31.00 1st Qu.:39.50 ## Mode :character Median :0 Median :38.00 Median :49.50 ## Mean :0 Mean :37.28 Mean :49.38 ## 3rd Qu.:0 3rd Qu.:44.00 3rd Qu.:59.50 ## Max. :0 Max. :61.00 Max. :69.50
Saving a dataset as a CSV file
write.csv(Loan_Default7, “Loan_Default7”,row.names = FALSE) write.csv(Loan_Default7, “Loan_Default7.csv”)
After the loan default dataset was cleaned, I then moved it to Tableau to look at the patterns and trends to give clearer insight for proper analysis
The Analysis: Here, I will be analyzing and explaining the visuals and of causing their implication
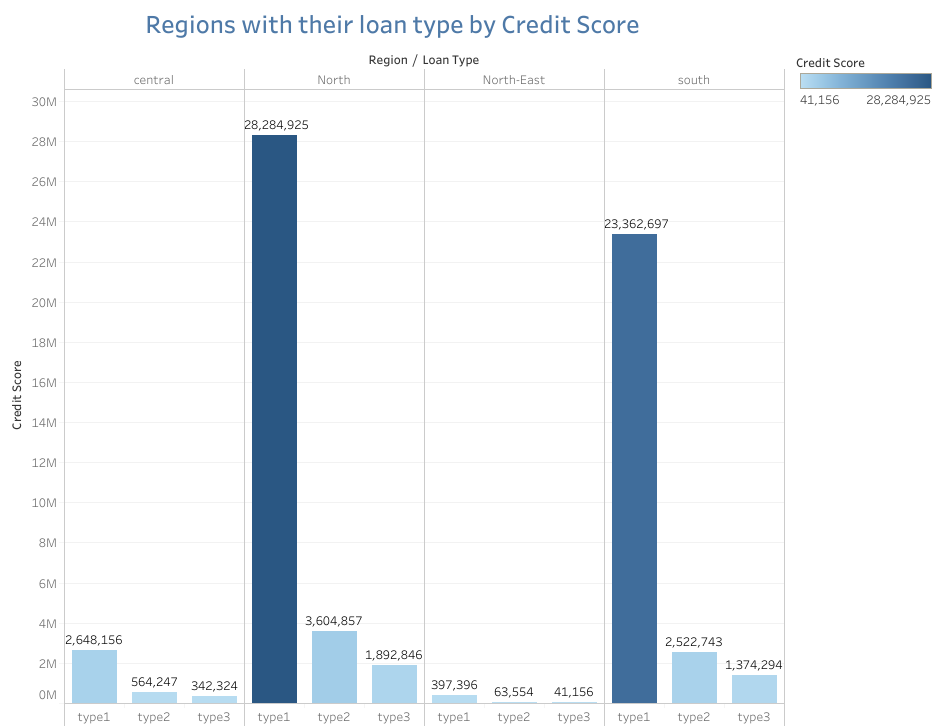
Analysis of the Visual: Regions with their loan type by Credit score:
The North region dominates with a total credit score of 28.28 million for loan type 1, which is the highest across all regions and loan types.
The South region follows closely with a total credit score of 23.36 million for loan type 1.
Loan type 1 has the highest total credit scores across all regions, indicating that it is the most significant loan type in terms of creditworthiness.
In contrast, loan types 2 and 3 have much lower credit scores, especially in regions like North-East and Central, where their contributions are minimal compared to loan type 1.
Implications:
Loan defaults in this context could arise from the high concentration of credit in loan type 1, making borrowers in the North and South regions particularly vulnerable to economic shocks or policy changes.
Regional disparities in creditworthiness, especially in the North-East and Central regions, may limit their access to better loan options, leading to higher default rates.
Additionally, the lower credit scores associated with loan types 2 and 3 in these underrepresented regions could suggest higher default risks due to financial instability and limited loan accessibility.

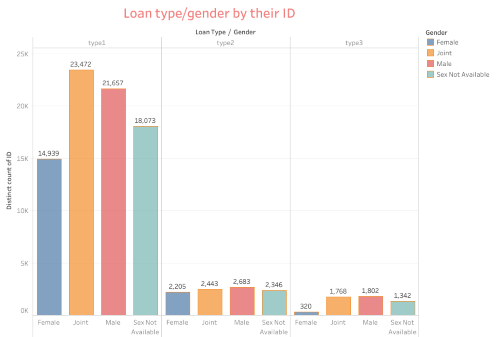
Analysis of the Visual: Loan type in terms of gender by Status(ID)
Gender Dominance in Loan Type 1: This visual shows that male borrowers dominate in loan type 1 with 21,657 distinct IDs, followed by joint applications at 23,472 IDs, and female borrowers at 14,939 IDs. This suggests that males are more likely to take out loans, particularly loan type 1.
Gender Distribution in Loan Types 2 and 3: For loan types 2 and 3, the gender distribution is much more balanced, but the overall volume of loans is significantly lower compared to loan type 1. Female, male, and joint applicants have a fairly even distribution, though males still slightly lead in loan type 2.
Gender Not Available: There is a noticeable portion of loan records lack gender information, which is most prevalent in loan type 1, with 18,073 IDs. This could imply data collection issues or borrowers choosing not to disclose gender information.
Implication:
Loan defaults may be more prevalent among male borrowers since they dominate loan type 1, which carries larger loan amounts and potentially higher default risks.
The significant number of records with missing gender information introduces uncertainty in risk assessment, making it challenging to develop targeted strategies to mitigate defaults.
Additionally, the lower participation of female borrowers in loan type 1 suggests a lack of financial inclusion, which might result in fewer opportunities to diversify default risks across different borrower groups.

Analysis of the Visual: Income within the Region by Loan Amount
This is a treemap that categorizes the loan amounts by region, with each region’s box size representing the total loan amount. The regions represented are North, South, and Central.
North Region: The largest block in the treemap, indicating that the North region has the highest total loan amount.
South Region: The second largest block, showing that the South region also has a significant loan amount but less than the North.
Central Region: The smallest block, which suggests that the Central region has the lowest total loan amount.
Implication:
Loan defaults may be higher in the North region due to the concentration of loans there, which increases the risk if the region faces economic challenges.
The South region, while significant, also carries a risk of defaults but to a lesser extent compared to the North.
The Central region, with the smallest loan amount, may have fewer defaults, but this could also indicate limited financial inclusion, potentially leading to untapped lending opportunities.

Analysis of the Visual: Loan Amount by Gender
This is another treemap that categorizes the loan amounts by gender, with boxes representing the Female, Joint, and Sex Not Available categories. The size of each block indicates the total loan amount for each gender category.
Joint Loans: The largest block, indicating that the majority of the loan amount is associated with joint accounts, likely involving multiple parties (e.g., married couples or business partners).
Sex Not Available: The second largest block, which might represent loans where the gender information was not provided or applicable (possibly business loans).
Female Loans: The smallest block, showing that the loan amount attributed to female borrowers is the least.
Implication:
Loan default risk may be higher in joint loans, which dominate the loan amounts, as they involve multiple parties who could share the financial burden but also face challenges in coordination or repayment.
The significant presence of loans with “Sex Not Available” raises concerns about data gaps, making it difficult to assess gender-specific default risks and hindering targeted interventions.
The smaller share of loans for female borrowers suggests gender disparity, potentially limiting their access to financial resources and increasing their vulnerability to financial instability.
Based on the comprehensive analysis of “The Impact of Credit Score on Loan Approval and Default Rates across Different Regions,”
The recommendations:
1. Targeted Risk Mitigation Strategies for High-Risk Regions
- Recommendation: Financial institutions should implement region-specific risk mitigation strategies, particularly focusing on the North and South regions where loan type 1 dominates. These regions exhibit higher loan concentrations, making them more vulnerable to economic downturns or policy shifts.
- Rationale: The North region holds the highest credit score concentration for loan type 1, followed closely by the South region. The significant exposure in these areas suggests that any economic disruptions could lead to widespread defaults. Tailored risk management plans, such as stricter lending criteria or diversified loan portfolios in these regions, could help reduce default rates.
2. Address Gender Disparities in Loan Approvals
- Recommendation: Develop initiatives to increase financial inclusion for female borrowers, especially in loan type 1, where male borrowers currently dominate. These could include offering targeted financial products or educational programs to encourage female participation in higher-value loans.
- Rationale: The analysis reveals that male borrowers are more likely to secure loan type 1, while female borrowers have less access, which could limit their economic opportunities. By addressing these gender disparities, financial institutions can foster greater financial inclusivity and potentially reduce the concentration of default risks among a single demographic.
3. Enhance Data Collection and Transparency
- Recommendation: Improve the quality and completeness of data, particularly concerning gender and other demographic factors. Financial institutions should prioritize accurate and comprehensive data collection during the loan application process.
- Rationale: A significant portion of loan records lack gender information, which hinders accurate risk assessment and the development of targeted risk mitigation strategies. Enhancing data transparency will allow for more precise analysis and better-informed decision-making, ultimately leading to more effective loan approval processes and default risk management.
4. Diversify Lending Portfolios in Underrepresented Regions
- Recommendation: Financial institutions should explore opportunities to diversify their lending portfolios in regions like the Central and North-East, which currently show lower loan activity and credit scores. This could involve introducing more flexible loan products or targeted marketing campaigns to increase borrower engagement.
- Rationale: The Central and North-East regions have lower loan volumes and credit scores, which could indicate limited financial inclusion and missed opportunities for lending. By diversifying lending portfolios in these regions, institutions can reduce their overall risk exposure and tap into new markets, potentially boosting overall financial performance.
5. Tailor Loan Products to Regional Economic Conditions
- Recommendation: Customize loan terms and conditions based on the economic stability and market conditions of each region. For instance, regions with volatile economic conditions might benefit from loans with more flexible repayment terms or lower interest rates.
- Rationale: The analysis suggests that regional economic conditions significantly influence loan outcomes, with regions facing economic challenges more likely to experience higher default rates. Tailoring loan products to meet the specific needs of borrowers in these regions can help reduce the likelihood of defaults while still supporting economic growth.
These recommendations aim to optimize lending strategies, enhance financial inclusion, and manage default risks more effectively, ultimately contributing to the overall stability and growth of the financial sector across different regions.